


An essential method for planning your projects!
Effective project and team planning remains a constant challenge for any company, whatever its size.
Coordinating human resources, managing time and ensuring a common understanding among team members are crucial to achieving objectives. This is where the Gantt Chart plays a transformative role. It revolutionizes the way we plan, monitor and execute our tasks and projects.
In this article, Eric Baroni immerses you in the world of the Gantt Chart. It explores how the Gantt Chart has become an invaluable resource for project planning. From managing deadlines and allocating tasks, to visualizing the overall workload. Discover in depth the benefits of this method.
What is a Gantt Chart and what does it consist of?
Named after its inventor, the American engineer Henry L. Gantt, the Gantt Chart is a powerful project management tool for planning, tracking and visualizing the progress of tasks and projects over time.
It's a graphical representation that shows the various stages of a project on a horizontal timeline. At first glance, a Gantt Chart may seem rather simple. However, it contains a wealth of information essential for team planning.
The key elements of a Gantt chart :
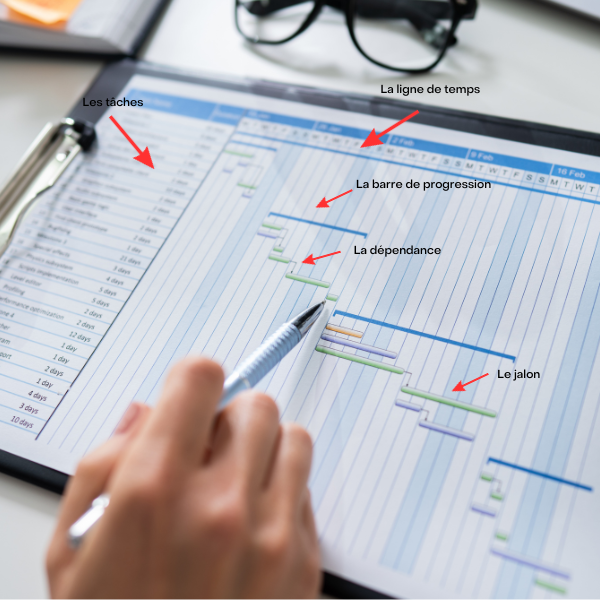
- Tasks :
Project tasks are listed vertically on the left-hand side of the diagram. Each task is represented by a horizontal bar.
- The Timeline:
The horizontal axis represents the time period from the start to the end of the project. Days, weeks or months are generally used for this time scale.
- Progress Bars :
Each task is illustrated by a horizontal bar on the timeline. The length of this bar indicates the expected duration of the task.
- Dependencies:
Dependency relationships between tasks are indicated by arrows or lines connecting the tasks. This indicates which tasks must be completed before others can begin.
- Milestones :
A milestone is an essential point of reference in a project, marking important stages or events. Unlike tasks, milestones have no duration of their own and represent precise moments in time. They are used to track key project milestones, such as the end of a phase or the achievement of important deliverables. Milestones help stakeholders track project progress and ensure that critical objectives are met on time.
- Resources :
Facteris Gantt charts include information on the human and material resources assigned to each task.
To sum up:
The Gantt Chart provides a clear, visual overview. From the temporal sequence of tasks, to interdependencies, to workload. This makes it an invaluable tool for team planning and project management. It enables project managers and stakeholders to work in tandem, monitor progress and ensure that everything is on schedule.
What are the advantages of Gantt charts in project planning?
- Clear visualization of tasks and deadlines
- A visual, easy-to-understand overview of all the tasks involved in a project.
- Efficient management of deadlines thanks to the chronological representation of tasks. This enables critical tasks, dependencies and potential bottlenecks to be quickly identified.
- It facilitates communication within the team and with external stakeholders. By assigning Resources to each task, you avoid availability conflicts and maximize team efficiency. You can clearly see which Resources are being used when. This makes it easier to manage work overloads and reallocate tasks if necessary.
- Although the Gantt Chart is a rigorous planning tool, it also offers flexibility. If modifications need to be made along the way, you can adjust the diagram to reflect the changes. This allows you to instantly assess their impact on the overall schedule.
- If updated regularly, it provides greater visibility of the progress of each task, as well as of the project as a whole.
The Gantt chart as seen by our ERP software Facteris
When Gantt inherits the power of your ERP data
Facteris Gantt charts are interconnected with the database. In this way, you can assign to each task: the schedules of your staff and the actual work performed throughout the project.
For efficient procurement management, Facteris' Gantt chart lets you plan your purchases. Purchases are linked to the selected task, but are also visible in your agendas.
During the course of your project cycle, you may need to collect important information. For example: work specifications, certificates of conformity, reports, e-mail exchanges, etc. With Facteris Gantt, all this information is centralized on a single screen. This ensures data security, scheduling and increased digitalization.
In Facteris, Gantt charts are linked to your customers' contracts. An overview screen gives you a visual centralization of all current projects and their respective progress. A simple click will take you into the details, for rapid processing and total efficiency.
In short, the Gantt Chart provides a clear view of tasks and deadlines, facilitating project management. Combined with ERP software such as Facteris, it enhances efficiency by integrating resource planning and centralizing information.

Eric Baroni – CEO at Multios
Did you like this article 💡 ? We'll be right back with our next topic
Discover what Facteris ERP can do for you 👉🏻 https://www.multios.be/facteris/